fbpx

Category: Surveys

  • 2023’s Best States for Green Burials

    Where can you easily plan a natural burial?

    To mark Memorial Day on May 29, Lawn Love ranked 2023’s Best States for Green Burials.

    To come up with our ranking, we compared the 50 states based on four categories. We factored in access to green burial locations, funeral homes specializing in natural burials, and demand, among 18 total metrics.

    See the five best (and five worst) states for green burials below, followed by key stats from our report.

    Best States for Green Burials
    Rank State
    1 California
    2 North Carolina
    3 Ohio
    4 Pennsylvania
    5 Massachusetts
    Worst States for Green Burials
    Rank State
    1 Alaska
    2 Nebraska
    3 Montana
    4 Delaware
    5 Wyoming

    Key insights:

    • Golden green burials: While traditional burial options are most affordable in California (No. 1), this state offers the most natural burial sites and tree burial forests. The Golden State also boasts the second-highest number of cemeteries certified by the Green Burial Council.

    • Earthly legacies: Plan a green funeral with ease in Pennsylvania (No. 4), boasting the most funeral homes certified by the Green Burial Council, followed by Ohio (No. 3) and Michigan (No. 6). Ohio claims the most conservation burial grounds — a practice that turns what would be a natural cemetery into a protected wildlife conservation area.

    • Contemporary cremation: In the U.S., cremations can generate around 360,000 metric tons of carbon dioxide emissions annually. Thankfully, greener options are available in Colorado (No. 17) and Illinois (No. 12), which tie for the highest number of aquamation (alkaline hydrolysis) providers. This water cremation process is currently allowed in 28 states.

    • Pacific Coast processions: Known for majestic scenery and promoting sustainable initiatives, the Pacific Northwest carries its eco-friendly values into end-of-life planning. Washington (No. 11) and Oregon (No. 9) both allow aquamation, body composting, and vault-free burials. Washington has the best access to body composting providers, followed by the Beaver State tied with Colorado (No. 17).

    • Massive options: In fifth place, Massachusetts boasts the most cemeteries certified by the Green Burial Council. The Bay State also claims the highest number of hybrid burial sites, where people can choose between a natural and traditional burial.

    • Interment interests: Residents of South Carolina (No. 10) have the highest interest in a green exit, followed by North Carolina (No. 2) and Pennsylvania (No. 4). These states also have high access to green Burial Locations. Some states — such as Louisiana (No. 34), Maryland (No. 36), and Tennessee (No. 29) — have high interest in natural burials but unfortunately lack those options.

     

  • Colorado ranks #2 for the most speeding fatalities in 2023

    It’s a fact of life that speeding while driving can put you at an increased risk of a collision. However, Forbes Advisor found that nationally, 11,242 of 38,788 auto accidents are due to speeding (29%). 

    But, some states are safer than others. That’s why Forbes Advisor analyzed auto accident fatalities as a result of speeding over the last decade to see which states have the most and least speeding deaths and if speeding fatalities have increased or decreased since 2010. 

    The new study from Forbes Advisor revealed that Colorado ranks #2 for auto accident fatalities due to speeding. 

    • 46% of auto accident deaths are due to speed for a total of 287 speeding fatalities. 
    • Since 2010, speeding fatalities in Colorado have increased by 10%. 

    See our state-by-state analysis and full methodology here: https://www.forbes.com/advisor/legal/speeding-deaths/

    Highlights from our report: 

    • The total car accident fatalities in Colorado per year is 622.
    • 30 people die every day in auto accidents due to speeding—that’s one fatality every hour. 
    • Since 2010, auto accident fatalities due to speeding have decreased by 2% across the nation.
    • Maine and West Virginia have experienced the biggest decrease in speeding-related fatalities since 2010, decreasing 23% and 20% respectively. 
    • South Carolina and Colorado have experienced the largest increase in speeding-related fatalities since 2010, increasing 11% and 10% respectively. 
  • Social Security Goes Furthest in These Colorado Counties – Study

    To determine the places where Social Security lasts longest, SmartAsset compared Social Security income in each county against the local cost of living. Counties where the average Social Security funds greatest exceeded living expenses were the places which ranked highest in the study.

    For a look at the top counties in Colorado, check out the table below:

    Rank County, State Cost of Living Annual Social Security Social Security Taxed? Social Security Goes Further – Index
    1 Custer, CO $19,211 $24,317 Yes 92.95
    2 Grand, CO $21,123 $22,833 Yes 79.22
    3 Rio Blanco, CO $20,574 $22,170 Yes 78.87
    4 Ouray, CO $21,870 $23,283 Yes 77.91
    5 Sedgwick, CO $18,836 $19,618 Yes 76.00
    6 Gilpin, CO $24,028 $24,817 Yes 75.05
    7 Chaffee, CO $19,722 $20,102 Yes 74.25
    8 Huerfano, CO $19,962 $20,098 Yes 73.24
    9 Pitkin, CO $26,418 $26,619 Yes 72.28
    10 Phillips, CO $19,647 $19,477 Yes 72.09

    The full study results, methodology and interactive map can be found here: [LINK]

  • Colorado had 6th highest rate of increased credit card usage to cope with inflation

    Recent data suggests that efforts to tame inflation are starting to have an effect. After nearly a year of steady interest rate increases by the Federal Reserve, year-over-year growth in the Consumer Price Index slowed to 6.0% in February 2023. This figure was the lowest since September 2021.

    While inflation might have finally reached its peak, many Americans continue to struggle with high prices. Nominal wages have grown since the start of the COVID-19 pandemic amid the Great Resignation and ongoing labor market tightness, but this rate of growth has trailed the rate of price increases for most workers. This cuts into household budgets and makes it more difficult for consumers to maintain their standard of living.


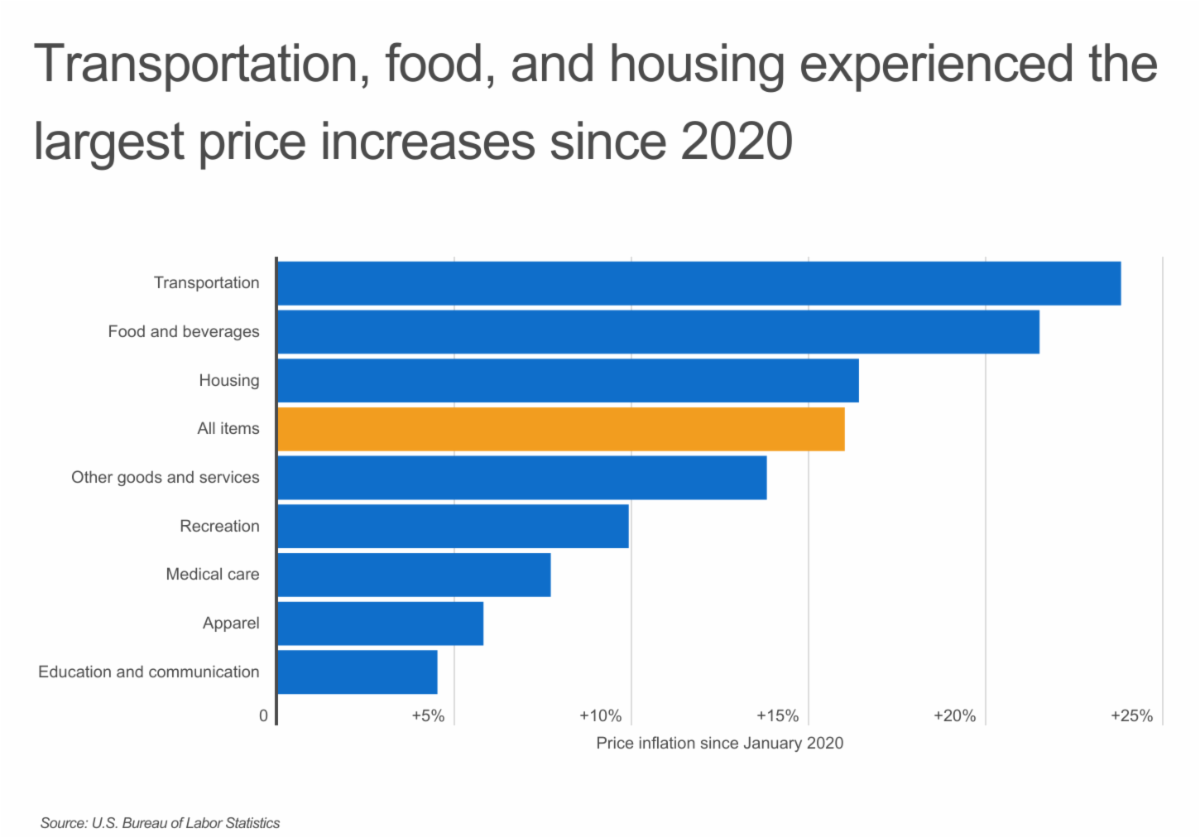
    One of the factors that has made the recent run of inflation especially challenging is the fact that the spending categories with the greatest price increases are necessities. Inflation has taken place throughout the economy, but over the last three years, the biggest spikes have occurred in the categories of transportation (+23.8%), food and beverages (+21.5%), and housing (+16.4%). These categories are difficult for households to cut back on, and the rate of inflation for each has exceeded the average 16% price increase across all items.


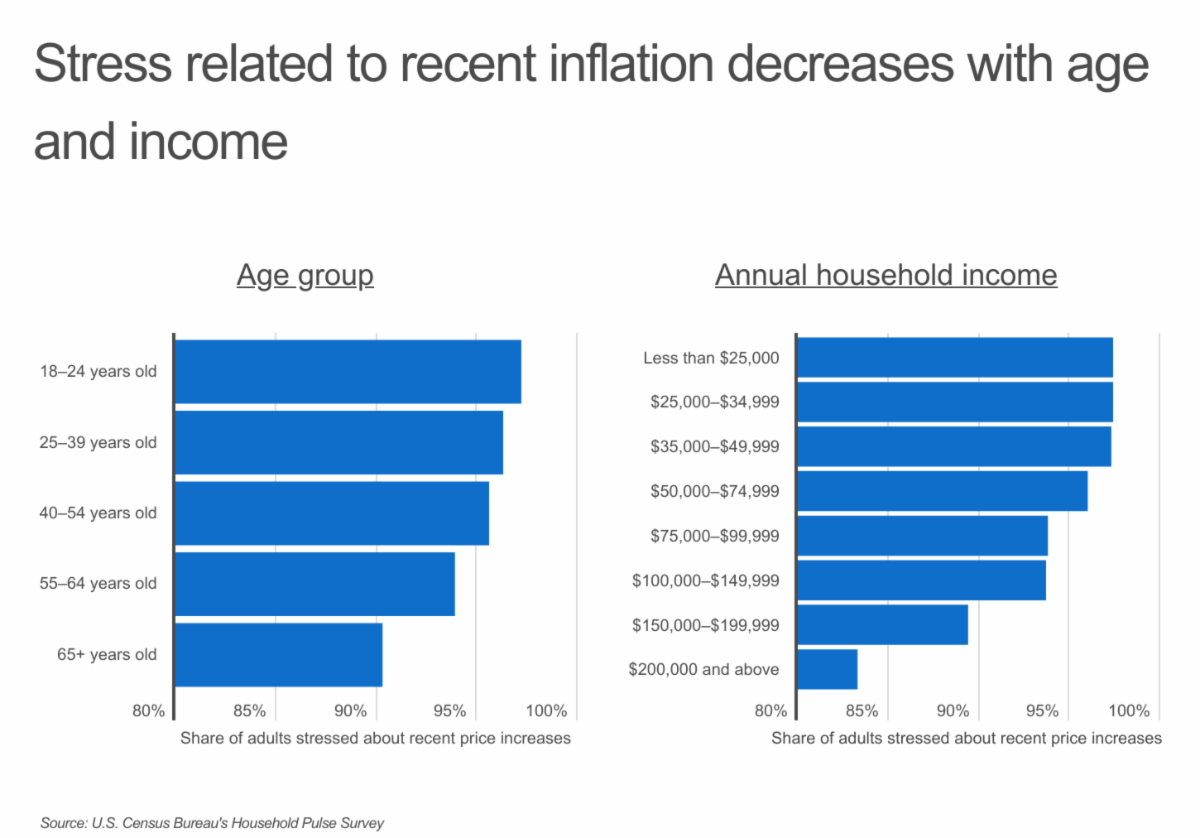
    Faced with these circumstances, U.S. households are feeling the pressure of inflation. More than 90% of adults in every age group express that they feel stressed about recent price increases. The most stressed age group is people aged 18 to 24, who are early in their careers and may not have savings, investments, or credit to fall back on. Inflation-related stress is also a widespread concern across income levels. In every income bracket below $75,000, more than 95% of people report feeling stressed about inflation. Even among the highest earners making above $200,000, more than 80% feel stress about recent price increases.


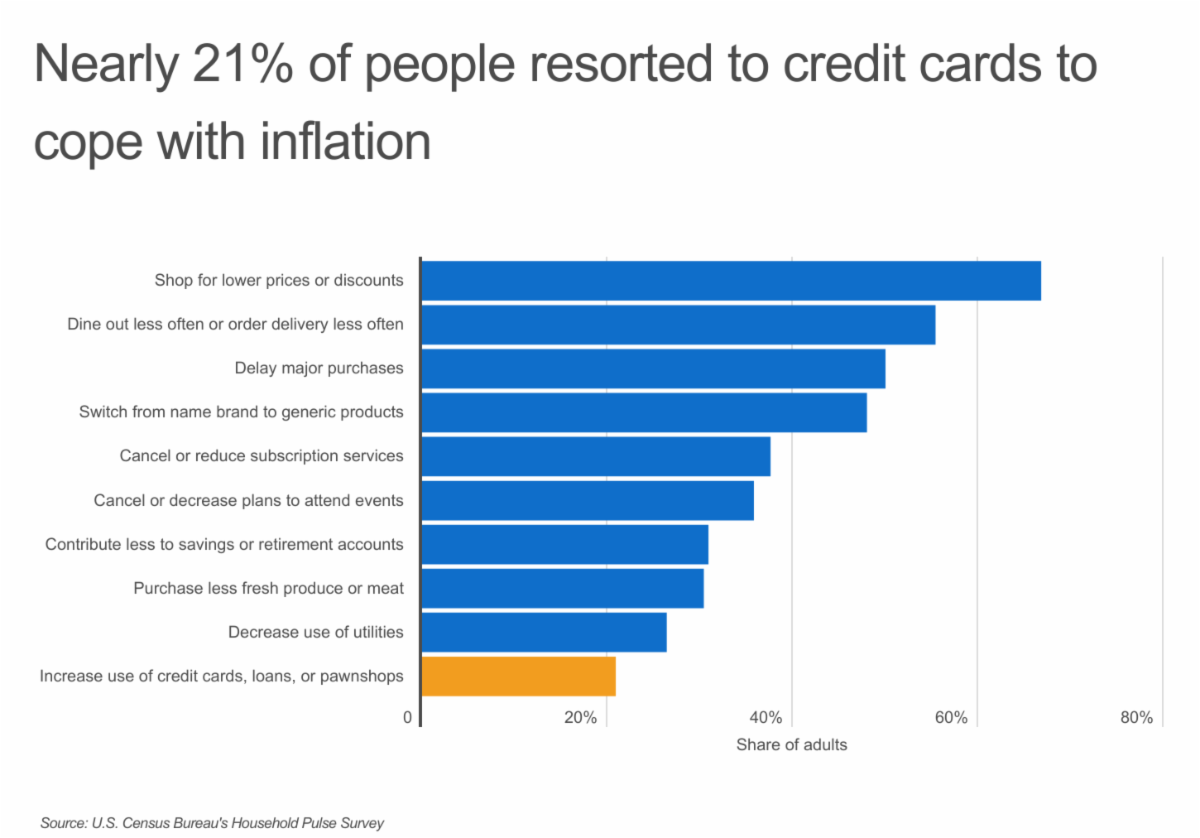
    Consumers are adopting a variety of strategies to cope with the effects of inflation. Most commonly, shoppers look to cut costs: more than two-thirds of adults say they look for lower prices or discounts when making a purchase, more than half are eating out less and delaying major purchases, and nearly half are switching from name brand to generic products.

    Inflation has also pushed 21% of adults to use credit cards, loans, or pawnshops to help pay their increased costs. Reliance on credit can be a quick way to help make ends meet in the short term, but doing so can be a risky move financially. People who carry balances on their credit cards or pay off loans slowly will ultimately pay more in interest—a risk exacerbated by the fact that interest rates have risen dramatically.

    U.S. households are not turning to credit cards in equal measure, however, as there are geographic differences in where adults have started using cards more frequently. States in the Midwest, like Wisconsin and South Dakota, and in the South, like Georgia and Mississippi, have the fewest adults reporting an increased reliance on credit cards to cope with inflation. In contrast, Western states like Utah, Arizona, Nevada, and California have all seen nearly one in four adults using their cards more often. But one New England state—Maine—sits at the top of the list, with 24.6% of adults reporting an increased reliance on credit cards due to rising prices.

    To find the states where inflation is driving increased reliance on credit cards, researchers at Upgraded Points analyzed data collected in early January 2023 from the U.S. Census Bureau’s Census Household Pulse Survey. Researchers ranked states according to each state’s share of adults that increased their use of credit cards, loans, or pawn shops to cope with price increases.

    The analysis found that 40.8% of adults in Colorado relied on credit cards to meet their spending needs, and 23.4% have increased their credit card usage due to recent price increases. Out of all states, Colorado experienced the 6th highest rate of increased credit card reliance due to inflation. Here is a summary of the data for Colorado:

    • Share of adults that increased their use of credit cards due to prices: 23.4%
    • Share of adults that relied on credit cards to meet spending needs: 40.8%
    • Share of adults stressed about recent price increases: 93.3%
    • Share of adults concerned about future price increases: 94.9%

    For reference, here are the statistics for the entire United States:

    • Share of adults that increased their use of credit cards due to prices: 20.9%
    • Share of adults that relied on credit cards to meet spending needs: 37.3%
    • Share of adults stressed about recent price increases: 94.4%
    • Share of adults concerned about future price increases: 95.8%

    For more information, a detailed methodology, and complete results, you can find the original report on Upgraded Points’s website: https://upgradedpoints.com/credit-cards/inflation-related-credit-card-use-by-state/

  • Golden Gate Canyon State Park Asking for Public Comments on Draft Management Plan

    Golden Gate Canyon State Park offers hiking, camping, and hunting experiences close to Denver

    GOLDEN, Colo. – Colorado Parks and Wildlife is seeking public input on Golden Gate Canyon State Park’s Management Plan. The third largest state park is creating a 10-year plan which will serve as a guiding framework for land management and resource use decisions.

    Public comment opens March 15 and ends April 15. Visitors can read the draft plan and comment through the park’s website.

    “We want the public to take a look at this plan and tell us if there’s anything we missed or could do better,” said Park Manager Todd Farrow.

    Golden Gate Canyon’s draft plan focuses on the rise in visitation and subsequent need for maintenance due to the increase in trail degradation and wildlife stress. This is the park’s first management plan since 1997.

    Public comments will be synthesized and added to the draft plan. If approved by the CPW Director, the plan will go into effect later this year.

    “We’re thinking 50 years ahead. The plan needs to be cognizant of how future generations are going to experience the beauty of Golden Gate Canyon State Park,” said Farrow.

    The stunning 12,000-acre space is one the busiest parks in Colorado and provides a backcountry experience within an hour of Denver.

  • LawnLove: Colorado is the No. 6 Best State for Horse Lovers

    Whether you work with horses for a living or are looking for equestrian escapes, America has plenty of room to roam on horseback.

    But which states are ideal for equine enthusiasts?

    To mark National Horse Protection Day on March 1, Lawn Love ranked 2023’s Best States for Horse Lovers.

    How does Colorado stack up?

    Colorado’s Rank in Some Key Metrics (1st = Best)

    • Number of Equestrian Programs – 3rd
    • Number of Horse Camps – 7th
    • Number of Rescue Horses Up for Adoption – 5th
    • Number of Barn Builders – 4th
    • Number of Horse Sanctuaries and Rescue Facilities – 4th
    • Annual Cost of Equine Care (as % of Average Household Income) – 10th

    To come up with our ranking, we compared the 50 states based on 27 metrics, such as equestrian programs, horseback riding trails, horse shows, and museums. We also considered horses for sale, boarding facilities, veterinarians, trainers, and affordability.

    Our full ranking is available here: https://lawnlove.com/blog/best-states-horse-lovers/

  • Colorado Ranks the Second Best State in the 2022 USA Healthy Aging Index

    The 2022 Healthy Aging Index, a newly released report about life quality in the US performed by digital health company DoFasting, ranks Colorado 2nd out of 50. The state hangs back from Utah by a slight difference. According to the research, the primary variable for such outstanding results concerning healthy aging is healthcare.

    The report analyzes 5 fundamental pillars of healthspan: demographics, economics, behavioral aspects, healthcare, and mental health. Underpinning these pillars are 25 indicators (5 per pillar) that are interrelated and work together to provide an overall measure of healthy aging across the 50 US states. Each indicator’s highest score is 4, the lowest is 0. The highest possible final score is 100; however none of the states have scored it.

    The 2022 Healthy Aging Index aims to highlight specific improvements that individual states could make to support healthy aging. For Colorado factors such as diet, divorce rate, and suicide rate have not shown excellent results and have let the Colorado state settle down with second place in the Healthy Aging Index.

    “According to recent meta-analysis, higher fruit and vegetable intake reduces mortality; Colorado scored only 1 out of 4 points when it comes to healthy diet,” says Supriya Lal, RD, MPH, health advisor at DoFasting.

    While the primary variable for such outstanding results of Colorado state concerning healthy aging is healthcare, indicating that the state is coping well with chronic diseases such as diabetes, obesity and  hypertension.

    “An Oxford university analysis involving nearly one million people worldwide has shown that obesity can trim years off life expectancy. A study showed that moderate obesity reduces life expectancy by about three years and severe obesity by ten years, equal to time loss due to lifelong smoking. This indicates  that such a comparable factor within the state can be an important consideration when it comes to healthy aging,” says Supriya Lal RD, MPH, health advisor at DoFasting.

    Image

     “Corresponding to the study, the best state for healthy aging is Utah, which is becoming an attractive destination for relocation due to affordable healthcare costs and beautiful nature. The worst state for healthy aging is Mississippi because of the lower quality education, lower income, and high poverty and crime rates,” says Kasparas Aleknavicius, MD, medical advisor at DoFasting.

    “Multiple recent studies have shown that a low-risk lifestyle can prolong life expectancy – and that most of these additional years of life are spent in good health,” adds Aleknavicius.

    Image

    Despite spending the most on healthcare worldwide, the United States falls well behind other world leaders in life expectancy rankings. The National Center for Health Statistics reports that after a historic drop in life expectancy in 2020, the country took another alarming hit in 2021, mainly due to the COVID-19 pandemic reports. And while life expectancy in other high-income countries has since increased, in the US, it fell by almost 3 years (down to 76.1 years).

    One of the reasons for such poor rankings is the US medical system. However, such measures also depend on a variety of socio-economic and behavioral factors that affect an individual’s health – diet, exercise, smoking, poverty, obesity, compliance with medical protocols, and many others.

    Image

     The research was carried out by experts in the digital health company DoFasting. The team of researchers and medical doctors analyzed 1,250 units of data from 25 reputable sources. The research was conducted to shed light on the uneven distribution of resources around the United States and help people make decisions regarding the most suitable place to live in.

    The methodology and explanations of how each factor influences healthy aging can be found here. The methodology behind the report and all calculations can be found here. Visualized information and web access can be found here.

  • 2023 New Release: Is your City Among the Best Ones to Raise a Family in the U.S.?

    According to the Best Cities to Raise a Family, the newest in-depth analysis of 151 cities conducted by the scholarship website Scholaroo, which examined 32 metrics organized into 7 key indicators — Safety, Health, Finances, Education, Leisure, Quality of Life and Home Atmosphere — Yonkers- NY was ranked as the best city, with almost all of the top 10 cities located on the country’s east side.

    On the other hand, Denver- CO, was ranked the worst, as a great reflection of the shortage of affordable housing that the city has been facing, due to the high median housing values and cost of living.

    **BEST AND WORST CITIES TO RAISE A FAMILY **
    (Top and bottom 10 cities ranked in descendent order)

    #1 Yonkers – NY
    #2 Warwick – RI
    #3 Charleston – WV
    #4 Burlington – VT
    #5 Las Cruces – NM
    #6 El Paso – TX
    #7 Fort Lauderdale – FL
    #8 Charleston – SC
    #9 Virginia Beach – VA
    #10 Chicago – IL

    #142 Charlotte – NC
    #143 Chattanooga – TN
    #144 Columbus – OH
    #145 Missoula – MT
    #146 Austin – TX
    #147 Stockton – CA
    #148 Los Angeles – CA
    #149 Minneapolis – MN
    #150 Santa Ana – CA
    #151 Denver – CO

    See below some cities and their positions in the ranking


    For the complete study and methodology, or additional details about Best Cities to Raise a Family, please visit >>> https://scholaroo.com/report/best-cities-to-raise-a-family/

  • Report: Colorado Ranks 10th in Prosperity Despite Pandemic and Economic Challenges

    Majority of states are enjoying pre-pandemic levels of prosperity according to new report by Milken Center for Advancing the American Dream and Legatum Institute

    WASHINGTON, November 15, 2022 –  Colorado ranks tenth in overall prosperity according to the American Dream Prosperity Index (ADPI), released this month by the Milken Center for Advancing the American Dream in partnership with Legatum Institute. The United States continues to see a rise in prosperity, even as we faced the long-term impacts of a pandemic and the economic realities of rising inflation and a shrinking economy. But while the overall trend points to a prosperous nation, prosperity continues to be unequally distributed regionally, often eluding rural communities and Black Americans.

    Prosperity is a multidimensional concept which the American Dream Prosperity Index seeks to measure, explore, and understand. The framework of the Index captures prosperity through three equally-weighted domains which are the essential foundations of prosperity — Inclusive Societies, Open Economies, and Empowered People. These domains are made up of 11 pillars of prosperity, built upon 49 actionable policy areas, and are underpinned by more than 200 reliable indicators.

    Colorado rounds out the top 10 states in overall prosperity. The state’s strengths include ranking first in business environment, seventh in education, eighth in governance, ninth in natural environment, and 11th in social capital. According to the Index, Colorado could focus its improvement on the safety and security (ranked 41st), infrastructure (ranked 34th), and personal freedom (ranked 28th) pillars. Since 2012, Colorado has seen the most improvement in social capital.  

    “While our nation faces many challenges including record inflation, increased gun violence, and a deteriorating mental health landscape, we are encouraged by the resiliency of communities across our country as they work to create prosperous lives for their residents,” said the Center’s President Kerry Healey. “The American Dream Prosperity Index was founded on the principle that better data leads to better decisions and outcomes. It is our goal to make this report one of the most important tools for local, state and federal lawmakers and civic leaders.”

    “We are encouraged by the steady rebound of prosperity post-pandemic, even in the face of unique regional challenges,” said Legatum Institute CEO Philippa Stroud. “The foundations of the U.S. economy continue to stand strong, particularly due to the innovative entrepreneurial mindset that Americans are known for. This forward momentum highlights the genuine push towards prosperity in the face of continued adversity.”

    Across the country, millions of Americans are facing challenges that continue to threaten prosperity. According to the 2022 ADPI, since 2012, all states apart from North Dakota have increased their prosperity, but prosperity remains unequally shared across and within states. For most people, 2022 has been a year of progress as the nation continues to recover from the COVID-19 pandemic and as the economy strengthens. However, this increase in prosperity is tempered by rising gun violence in nearly every state. Also detrimental to the nation’s prosperity is the deteriorating mental health of America, marked by a rise in suicides and opioid-related deaths, even as Americans’ overall health continues to improve.

    ADPI’s key findings also point to waning social cohesion across the country as another roadblock to U.S. prosperity. This is seen in the decreasing number of Americans who have helped a stranger, donated money to charity, volunteered or frequently talked to a neighbor.

    ADPI National Patterns toward Greater Prosperity:

    • In 2022, 26 states have recovered to pre-pandemic levels of overall prosperity, with Oklahoma, New Jersey and New Mexico seeing the biggest improvement. Reasons for the improvement in these states vary, but economic factors such as the increasing number of entrepreneurs played a key role in the post-pandemic rebound and bodes well for further improvement.
    • Over the past decade, Americans’ physical health have improved. Since 2012, rates of smoking have fallen by nearly a third, excessive alcohol use has decreased by 17% and pain reliever misuse has decreased by 21%. 
    • The long-term downward trend in property crime is an encouraging development across the United States, with all but six states improving over the past decade.

    ADPI Key Findings:

    • While U.S. prosperity rebounded post-pandemic in 2022, current record inflation threatens this recovery
    • In 2022, Prosperity has increased in every state except North Dakota, but this progress remains unequally distributed within state and local communities and across ethnic groups
    • High and rising gun violence in nearly every state is impacting American’s individual sense of security and prosperity
    • Mental health has deteriorated in every state, including increased deaths of despair
    • A continuing decline in social cohesion and group relationships at all levels of society creates barriers to prosperity.

    Although the data does highlight a substantial number of barricades to prosperity, ADPI can be used to craft unique solutions across all levels of government. A deeper examination of prosperity, prompted by the Index, can reveal individual issues that each state can tackle in order to advance the prosperity of its citizens. This push towards the development of local data-led initiatives, rather than a ‘one size fits all’ approach, is essential for transformation across the country.

    The Index has been designed to benefit a wide range of users, including state and county leaders, policymakers, investors, business leaders, philanthropists, journalists, researchers and U.S. citizens.

    View the 2022 ADPI here.

    View Washington’s state profile here.

    View the state-by-state prosperity rankings here.

    View state-by-state rankings in specific categories by clicking on the category below.

  • States Spending the Most on Health and Hospitals

    The challenges facing the healthcare sector in the U.S. are numerous. The U.S. lags behind other developed nations on many key metrics of health, including life expectancy, chronic disease burden, and avoidable deaths. The population has been growing older on average with the aging of the Baby Boomers, creating increased demand for health services. Longtime public health challenges like obesity, substance abuse, and mental illness have wide-ranging impacts on Americans’ overall health and well-being. And in the last few years, the COVID-19 pandemic has placed unusually heavy strain on healthcare providers and hospitals.

    With these many interlocking and compounding challenges, the U.S. spends heavily to support the healthcare system. According to federal data, national health expenditures in the U.S. total $4.1 trillion per year, making up nearly 20% of the nation’s GDP. The bulk of this spending comes from the federal government, which contributes 36.3% of expenditures, and U.S. households, which account for 26.1%.

    Often underappreciated in discussions of the U.S. health system is the role of state and local governments. States and localities frequently fund public hospitals, health inspections, mental health and substance abuse programs, water and air quality programs, and payments to private hospitals for public health services. State and local governments funded 14.3% of total national health expenditures in 2020.


    This spending is one of the most significant budgetary responsibilities of state and local governments. Health and hospitals represent the third largest spending category for state and local governments, behind only public welfare and elementary and secondary education. Collectively, governments spend $345 billion on health and hospitals each year, accounting for nearly 10% of all state and local spending.


    State and local spending on health and hospitals on a per-capita basis has also grown over time. In the year 2000, state and local governments spent $678 per capita on health and hospitals in inflation-adjusted dollars. By 2020, that figure had risen to $1,040—an increase of more than 50%.


    However, this trend has not played out the same in all locations. In fact, 13 states have seen a decline in health and hospital spending per capita over the last decade, led by Arizona, where spending has declined by more than 50%. In contrast, other states have seen rapid growth in health spending. Vermont’s inflation-adjusted state and local spending per capita more than doubled between 2010 and 2020, from $355 to $730, and Utah’s 96.2% rate of growth was not far behind.

    Just as trends in health spending have varied by geography, total spending also looks different from state to state. Nationwide, states and localities spend around 9.9% of their budgets on health and hospitals, at a total of $1,047 per capita. But a number of states and localities spend well above these figures, including Wyoming, where the per-capita spending is nearly triple the national average, and South Carolina, where health and hospital spending represents nearly 20% of state and local expenditures.

    The data used in this analysis is from the U.S. Census Bureau. To determine the states that spend the most on health and hospitals, researchers at HowtoHome.com calculated health and hospital spending as a share of total spending. In the event of a tie, the state with the greater total health and hospital spending per capita was ranked higher.

    The analysis found that health and hospital spending in Colorado amounts to an annual $723 per capita—6.9% of the state’s total spending—compared to the national average of $1,047. Here is a summary of the data for Colorado:

    • Health & hospital spending as a share of total: 6.9%
    • Total health & hospital spending per capita: $723
    • Total health & hospital spending: $4,196,424,000
    • Total direct expenditures: $60,879,680,000

    For reference, here are the statistics for the entire United States:

    • Health & hospital spending as a share of total: 9.9%
    • Total health & hospital spending per capita: $1,047
    • Total health & hospital spending: $345,008,758,000
    • Total direct expenditures: $3,494,136,935,000

    For more information, a detailed methodology, and complete results, you can find the original report on HowtoHome.com’s website: https://www.howtohome.com/us-states-that-spend-most-on-health-and-hospitals/